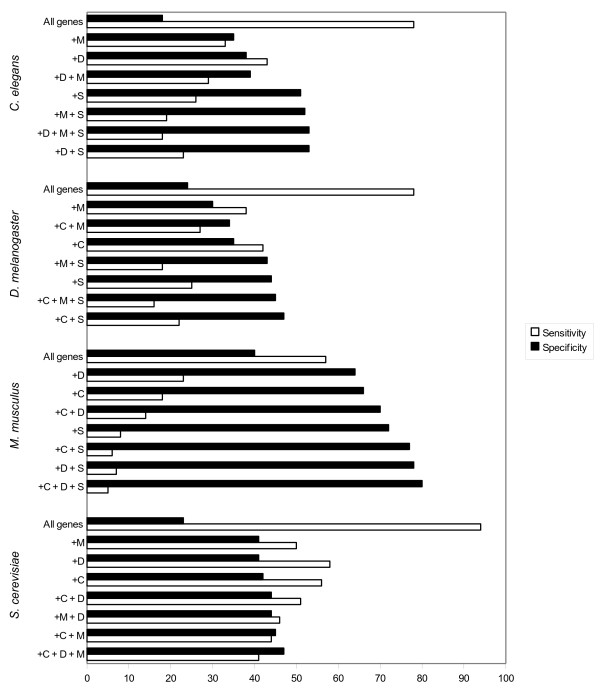
Figure 2.
Effect of gene conservation on probability of essentiality of genes. This graph shows the probability of essentiality for genes from C. elegans, D. melanogaster, M. musculus and S. cerevisiae respectively, modified by their phyletic profile. The percentages show the number of genes with lethal phenotypes divided by the total number of genes with orthologues in the species being compared. Specificity refers to the proportion of genes in the selected subset that are essential and sensitivity refers to the proportion of the total number of essential genes for that species that are recovered in the selected subset. In all cases, essentiality was assessed for genes without paralogues. The probability of essentiality for genes in each of the specified subsets versus a gene selected at random from the query genome were all statistically significant (P < 10-05), as determined using Fisher's exact test (Additional File 2). C = C. elegans, D = D. melanogaster, M = M. musculus, D = D. melanogaster, S = S. cerevisiae.

