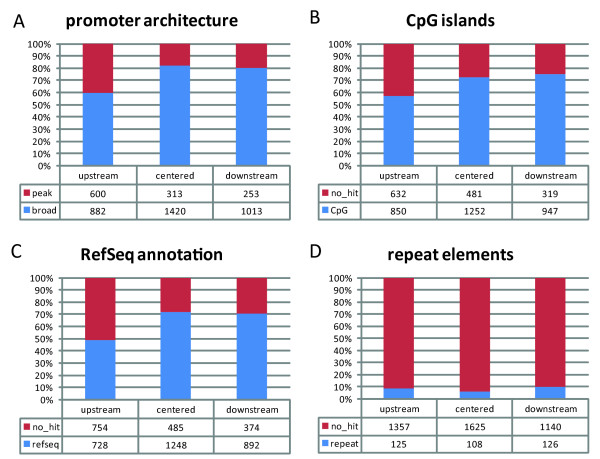
Figure 3.
Genomic features of all 4,481 clustered promoters. Distribution of (A) promoter architecture (single peak vs. broad) (B) overlap of CpG islands to the core promoter, (C) available RefSeq annotation (absence indicates novel promoters) (D) repeat elements to the three clusters which have the H3K9ac signal upstream, centered and downstream of the core promoter.

