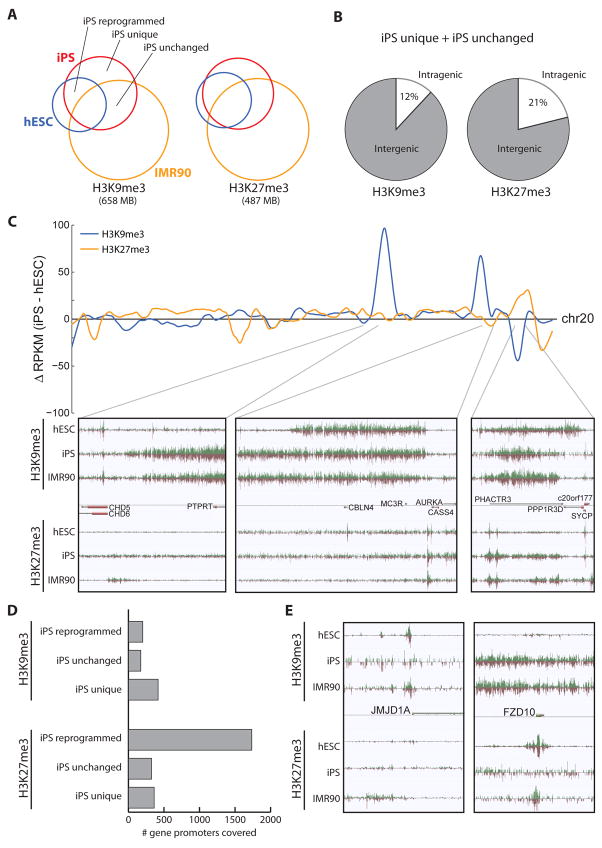
Figure 7. Comparison of repressive chromatin structure in hESC and iPS cells.
Overlap of repressive chromatin domains in hESC (blue), iPS (red), and IMR90 (yellow) cells, for H3K9me3 (left) and H3K27me3 (right). The total coverage of these modifications is indicated below. Regions related to reprogramming are labeled: iPS reprogrammed regions, defined as overlap of iPS and hESC but not IMR90; iPS unchanged regions, defined as overlap of iPS and IMR90 but not hESC; and iPS unique regions. (B) The average genic distribution of iPS unchanged and iPS unique regions. (C) (top) Difference in RPKM of iPS profiles compared to hESC profiles for H3K9me3 (blue) and H3K27me3 (yellow) throughout the length of chr20. (bottom) Zoomed in views of genomic regions having differences between iPS and hESC cells. (D) For the three types of iPS regions, the number of gene promoters covered by H3K9me3 (top) or H3K27me3 domains (bottom). (E) Snapshots of repressive chromatin structure at JMJD1A (left) and FZD10 (right) promoters, illustrating differences in iPS and hESC cells.

