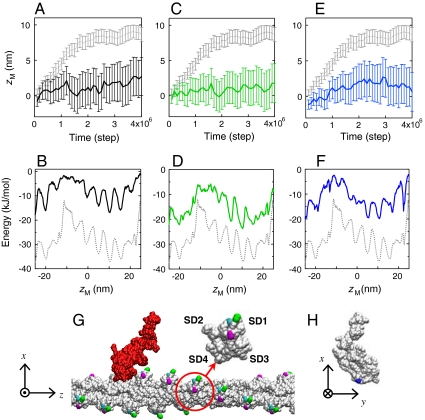
Fig. 3.
Effects of ionic concentration and amino acid mutations. (A, B) The average time course of zM and the energy landscape which were obtained at 100 mM KCl are shown, respectively, together with those of the original (at 25 mM KCl; gray dotted line). The error bars represent the standard errors. (C, D) The results for the double mutation D1H/E2H (green) are shown together with those of the wild type actin. (E, F) The results for the charge neutralizing mutation introduced on the lysines in loop 2 of myosin (K640/K641/K642) are shown (blue), together with those of the wild-type myosin. (G) The positions of the mutated residues in actin are depicted: D1/E2 (green), D24/D25(magenta), and E99/E100 (cyan) (The results for D24/D25 and E99/E100 are presented in Fig. S3). An actin protomer (circled) is displayed in a magnified view, with the subdomains (SD1-4) labeled. (H) The positions of the mutated lysines in myosin are shown (blue).

