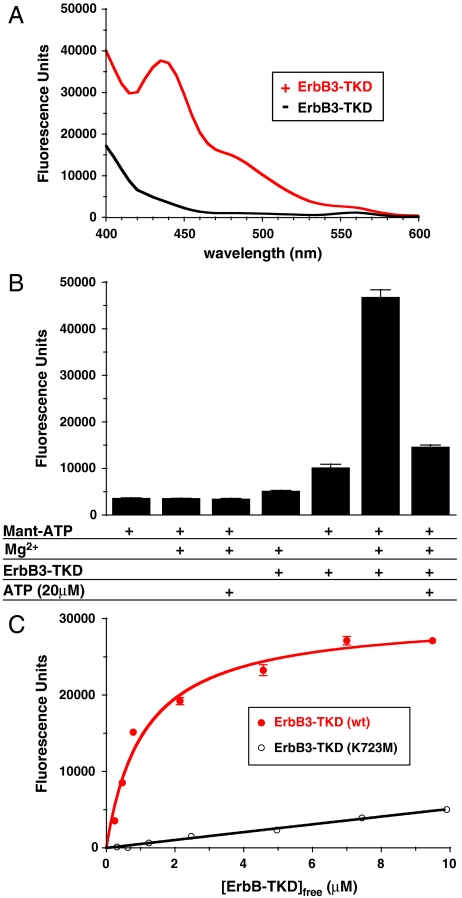
Fig. 2.
Mant-ATP binding to ErbB3-TKD648–1001. (A) Fluorescence emission spectra (with excitation at 280 nm) for 1 μM mant-ATP (plus 5 mM MgCl2) in the absence of ErbB3-TKD (Black) and with 3 μM added ErbB3-TKD648–1001 (Red). (B) Fluorescence emission of 1 μM mant-ATP at 450 nm under different conditions (with excitation at 280 nm). Protein-to-mant FRET is only seen when 1 μM mant-ATP, 5 mM MgCl2, and 3 μM ErbB3-TKD648–1001 are all present. The FRET signal is greatly reduced by adding 20 μM ATP to saturate the nucleotide-binding site in the kinase (far right). (C) Titrating ErbB3-TKD648–1001 into a 0.6 μM mant-ATP solution containing 5 mM MgCl2 yields a hyperbolic binding curve fit to give a Kd value of 1.1 μM for wild-type ErbB3-TKD. Mean ± standard deviation are shown for at least 3 independent experiments in B and C.

