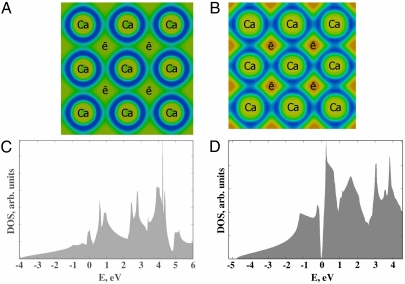
Fig. 1.
Valence ELF (including semicore 3s and 3p states) and density of states of fcc-Ca at (A, C) 1 atm and 18 GPa (B, D). ELF plots (A, B): (100) sections through positions of Ca atoms and nonnuclear electron density maxima (“e”). Minimum/maximum ELF values are 0.05/0.73 in (A) and 0.08/0.84 in (B), with contour spacing of 0.05. Note ELF peaks in the core regions and in the interstices (valence electrons expelled from the core regions); at 18 GPa interstitial valence electrons are more localized than semicore electrons. In DOS plots, energies are relative to the Fermi level; note the narrow band gap at 18 GPa.

