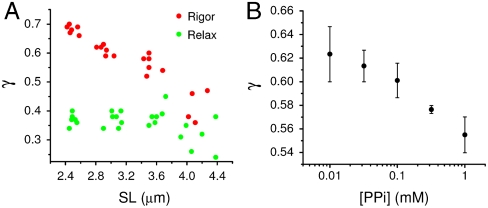
Fig. 2.
SPA sensitivity to the fraction of attached myosin cross-bridges. (A) Measured γ versus SL in a representative demembranated rabbit fiber. The data in relaxing solution and in rigor are shown by green and red circles, respectively. (B) Measured γ versus PPi concentration. Each point represents the average ± SD of three fibers.

