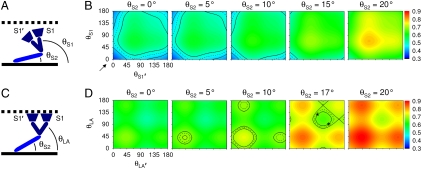
Fig. 4.
SPA modeling. (A) Scheme of the myosin molecule (S2 in light blue and S1 in dark blue, thick filament as black continuous line) detached from actin (black dotted line). In the scheme, the Z line is on the right side. The two S1 heads are indicated by S1 and S1′. For clarity, only the angle of one head is indicated (θS1). (B) Calculation of γ (surface color plot) as a function of θS1 and θS1′ for different values of θS2. The value of γrest on the surface plot is pointed by the arrow. The black iso-γ curves (average, dashed line; one SD interval, solid lines) report the measured value of γrest. (C) Scheme of the myosin molecule attached to actin. The catalytic domains (dark blue trapezoids) are rigidly fixed to actin. For clarity, only the lever-arm angle of one head is indicated (θLA). (D) Calculation of γ as a function of θLA and θLA′ for different values of θS2. The black iso-γ curves report the measured value of γrig. The asterisks show the geometry of rigor heads according to cryo-EM.

