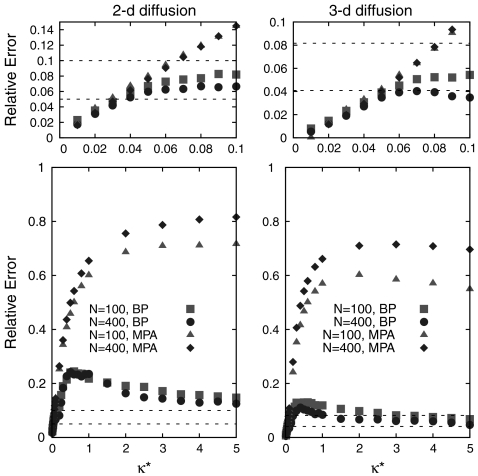
Fig. 6.
The relative error  in the estimates of the diffusivity over K measurements vs. the actual value of the diffusivity κ∗. Circles and squares refer to BP while triangles and lozenges refer to the MPA. κactual is the actual value of the mean-square displacement of the particles, i.e., it includes fluctuations around κ∗ due to the finite number N of particles. The data are averaged over 1,000 (for N = 100) and 250 (for N = 400) realizations and compared to the relative statistical error
  (dashed horizontal lines). The case of 2D diffusion is shown on the left, and the 3D case is on the right. The top figures are zooms into the low diffusivity region.

