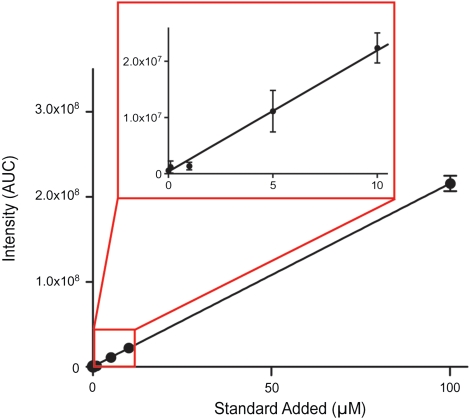
Fig. 3.
Instrument response following standard addition of purified apolipoprotein C-III into three technical replicates of HDL3 isolated from human plasma. Standards range in concentration from 100 nM to 100 μM. Data points correspond to signal from charge states (M + 11H)11+ to (M + 7H)7+ summed and plotted as area under curve (linear regression performed y = 2,152,772.4634x + 402,817.8176, R2 = 0.999946). Error bars represent standard error of the mean.

