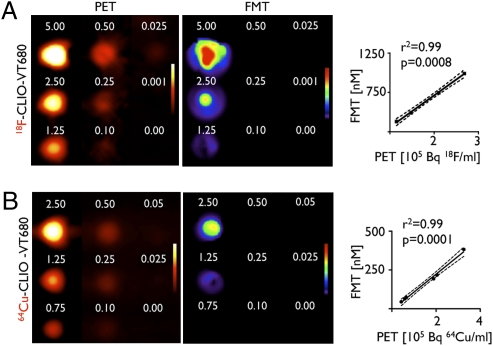
Fig. 2.
Signal correlation in phantoms. Two-dimensional images of tissue phantoms, acquired by PET and FMT imaging. 18F-CLIO-VT680 (A) and 64Cu-CLIO-VT680 (B) were diluted serially, and the concentration was reported according to the iron content in the nanoparticle core. The correlation between FMT and PET signals is shown on the right. FMT signals are reported as fluorescence concentration (nM); PET signals, as counts per volume (Bq/mL).

