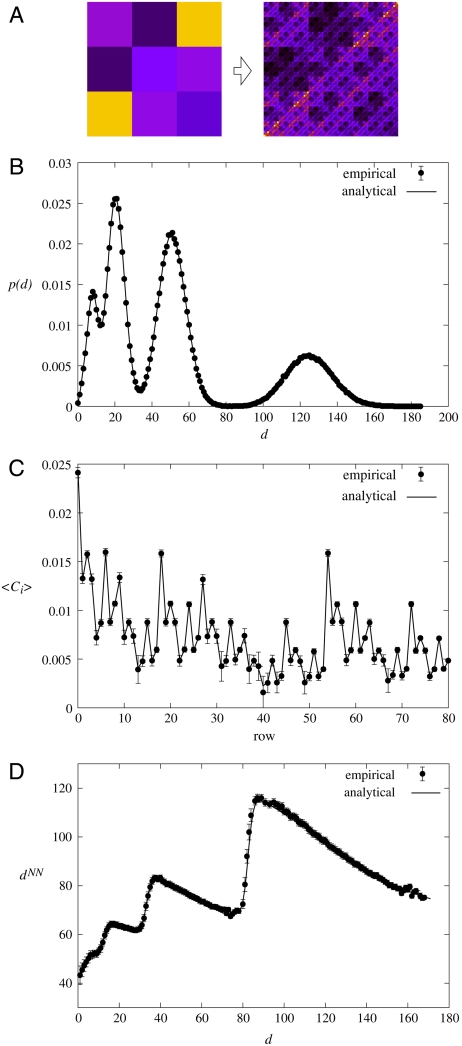
Fig. 3.
Comparison between the analytical and empirical result for a randomly chosen generating measure. (A) The generating measure (Left) and the link probability measure (Right) after k = 4 iterations. The number of rows in the generating measure was set to m = 3 with equal box lengths li = 1/3; the corresponding initial linking probabilities pij were chosen randomly. (B) The degree distribution obtained by averaging over 100 samples with N = 5,000 nodes each (symbols), plotted together with the analytical result obtained from Eq. 5 (continuous line), showing very good agreement. The error bars (showing the standard error of the mean) are smaller than the symbols. (C) The average clustering coefficient 〈C〉 of nodes falling into the same row of the final link probability measure plotted in function of the row index. Similarly to the previous panel, the symbols correspond to the empirical result (the error bars show the standard error of the mean), whereas the continuous line was obtained from analytical calculations. (D) The nearest neighbors average degree in function of the node degree obtained both empirically by averaging over the samples (symbols, with the error bars corresponding to the standard error of the mean) and analytically (continuous line).

