Fig. 4.
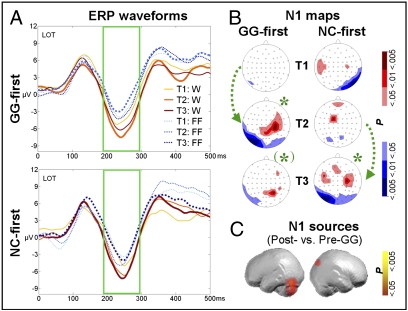
Print-sensitive ERP activity in the visual N1 after GG training. (A) Training effects on the N1 (189–295 ms) at LOT sites for the GG-first (Upper) and NC-first (Lower) groups, respectively. Waveforms after GG training are plotted with thicker lines. Print sensitivity emerged as a pronounced difference in amplitude between W and FF in the N1 interval after GG training. (B) Statistical N1 ERP t-maps illustrating the W–FF contrast for the GG-first (Left) and NC-first (Right) groups. According to TANOVA, W and FF map topographies differed after GG training at T2 for the GG-first group and at T3 for both groups. *, P < .05; (*), P < 0.1). Green arrows illustrate periods with GG training. (C) Estimated N1 Post- vs. Pre-GG sources for W–FF in the occipito-temporal cortex and right cuneus.

