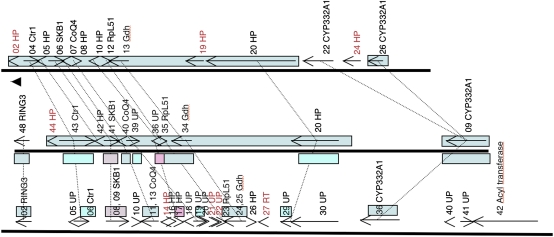
Fig. 1.
Syntenic relationship at the CYP332A locus. Schemes at scale representing, from top to bottom, H. armigera, S. frugiperda, and B. mori. Arrows represent genes predicted by KAIKOGAAS. Only valid genes are shown (Fig. S1). Synteny links are shown with black dotted lines. In text boxes, gene ID, or for other genes, HP, unknown protein (UP; presence of a match to an EST with a threshold of 10−40 by BlastN). Synteny blocks (as defined in text) are shown as colored boxes spanning genes arrows in the case of H. armigera and S. frugiperda, below and above gene arrows in the case of S. frugiperda and B. mori, respectively. See Fig. S2 for gene name abbreviations.

