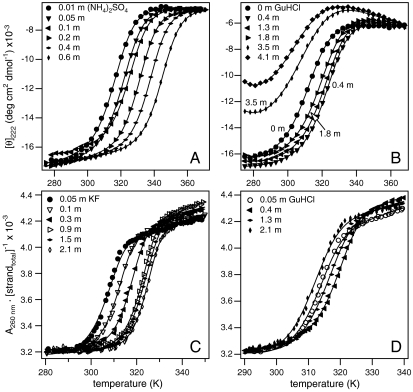
Fig. 1.
Thermal melting transitions of lac DBD and DNA oligomer at different salt concentrations. Protein unfolding data for Na2SO4 (A) and GuHCl (B) and 12 bp DNA melting data for KF (C) and GuHCl (D). Mean residue molar ellipticities [θ]222 and absorbances (A260) are plotted vs. temperature. Curves indicate global fits to the two-state melting transitions.

