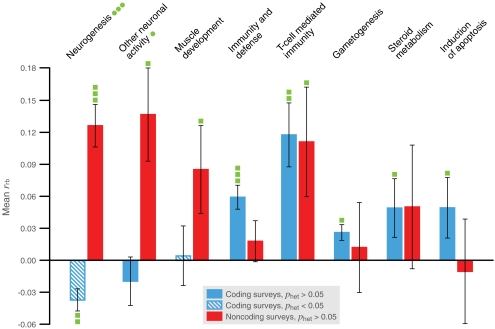
Fig. 1.
Large PANTHER biological processes enriched with positive selection across coding or noncoding surveys. Plotted categories are all but three of those for which (i) the mean number of genes per survey is at least 50 across all surveys, (ii) the mean rank-biserial correlation (rrb) between score for positive selection and membership in the category is significantly positive (Penr < 0.05) across coding or noncoding surveys, and (iii) heterogeneity is nonsignificant (Phet > 0.05) across the same surveys. The three such categories not plotted are “ectoderm development,” “neuronal activities,” and “mesoderm development,” which are not significantly enriched when their respective subcategories “neurogenesis,” “other neuronal activity,” and “muscle development” are subtracted. Error bars represent SEM- rrb. Green blocks on error bars indicate one-tailed P values for the one-sample z test of mean rrb = 0. One block, 5 × 10⁻⁴ < P < 0.05; two blocks, 5 × 10⁻⁶ < P < 5 × 10⁻⁴; three blocks, P < 5 × 10⁻⁶. Similarly, green dots on category names indicate two-tailed P values for two-sample z tests of equal mean, rrb, across coding versus noncoding surveys.

