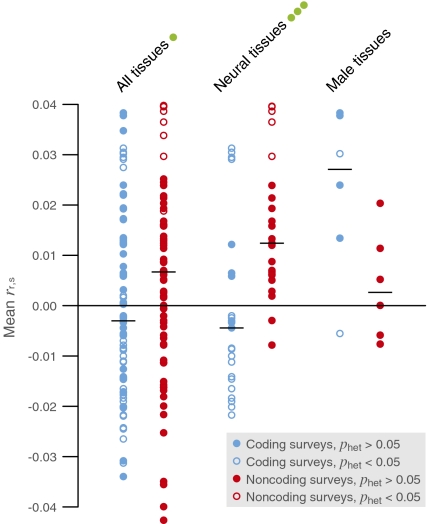
Fig. 3.
Expression specificity and positive selection across coding and noncoding surveys. Neural tissues and male (reproductive) tissues are highlighted. Circles represent mean rank correlation (rr,s) between the score for positive selection and specificity to tissues in the Novartis Gene Expression Atlas. Horizontal lines indicate median of means. Green dots on group names indicate two-tailed P values for the Wilcoxon signed-rank test of equal median across coding versus noncoding surveys: one dot, 5 × 10⁻⁴ < P < 0.05; three dots, P < 5 × 10⁻⁶.

