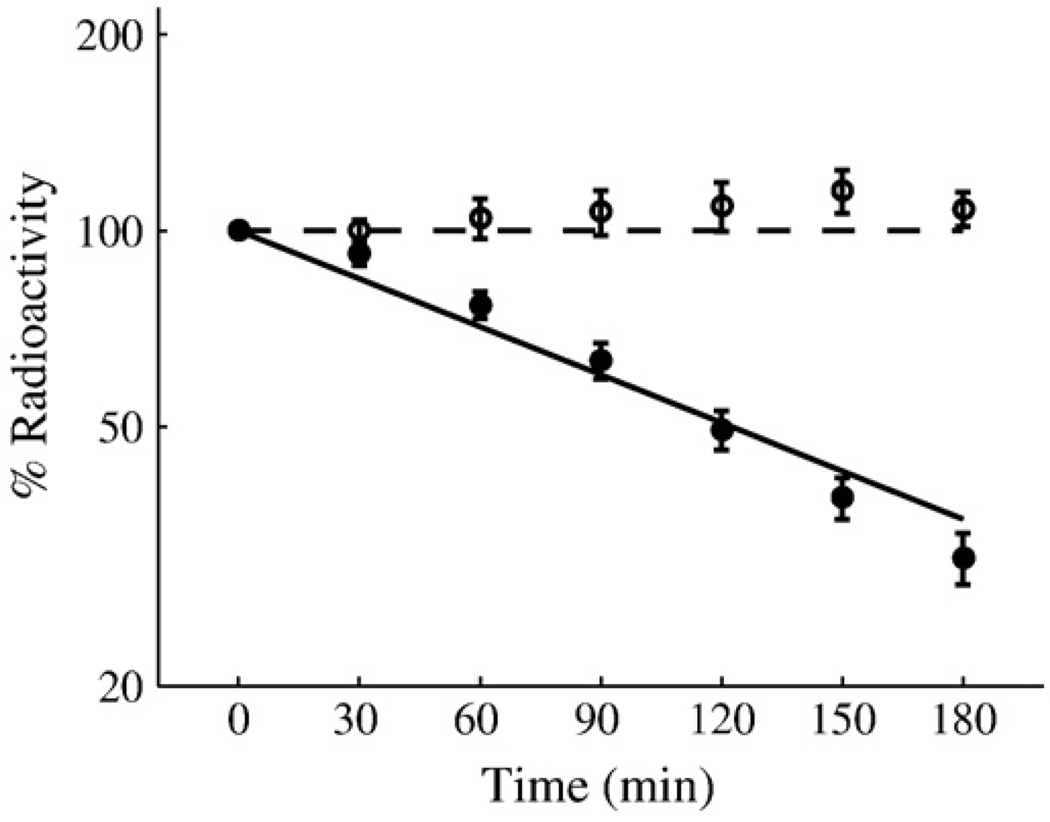
Fig 3.
A replot of experimental data from Mettert and Kiley8 compared with the output of the model in Fig. 2. Shown are in vivo degradation rates of wild-type FNR under aerobic (filled circle) and anaerobic (open circle) conditions as measured by [35S]methionine pulse-chase radiolabeling assays followed by immunoprecipitation of FNR. Also shown are model-generated degradation rates of wild-type FNR under aerobic (continuous line) and anaerobic (broken line) conditions. Each pulse-chase data point represents the average of at least three experiments. The y-axis is total radioactivity as a percentage of the initial value at time zero. Time is in minutes.

