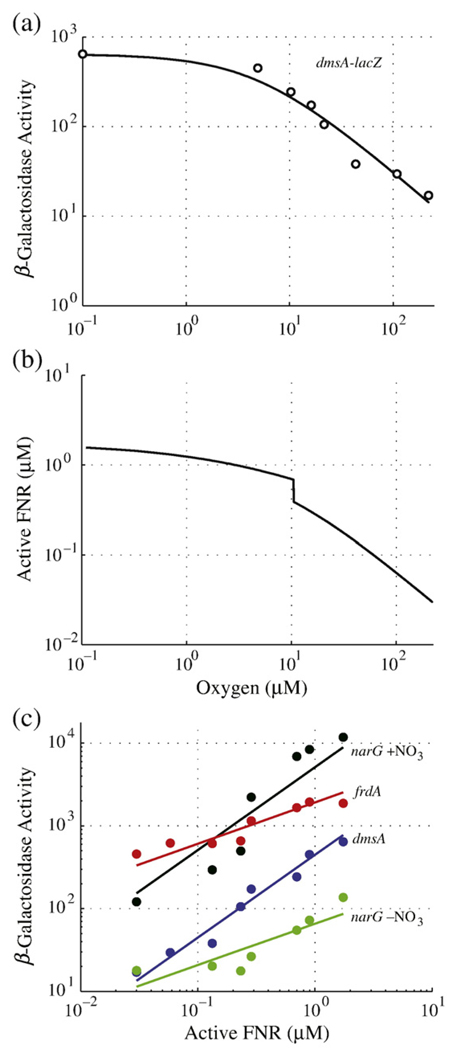
Fig 5.
Estimation of active FNR concentrations in vivo. (a) An example of experimental expression data (open circle) (replotted from Tseng et al.16 for the dmsA operon) fit with a Michaelis–Menten equation (continuous line). Half-maximal expression occurs at an O2 concentration of 4.9 µM. The leftmost data point occurs at [O2] = 0 µM and has been shifted along the x-axis to illustrate maximal dmsA expression on the logarithmic scale. (b) Standard curve estimating active FNR concentration as a function of oxygen saturation, calculated by setting the derivatives [Eqs. (1)–(3)] to zero and solving for active FNR (X3) over a range of oxygen (X6) concentrations. The equilibrium disassociation constant for active FNR binding to DNA is predicted to be 0.87 µM (i.e., the level corresponding to [O2] = 4.9 µM). (c) Correlation of active FNR levels with experimentally determined expression for anaerobic pathway genes (dmsABC, narGHJI, and frdABCD) at varying oxygen saturation levels. Experimental data (points) are replotted from Tseng et al.16 dmsA–lacZ (blue circle) with a fit of y=x+2.65 (blue line), narG–lacZ in the presence of nitrate (black circle) with a fit of y=x+3.71 (black line), narG–lacZ in the absence of nitrate (green circle) with a fit of y=0.5x+1.82 (green line), and frdA–lacZ (red circle) with a fit of y=0.5x+3.28 (red line).

