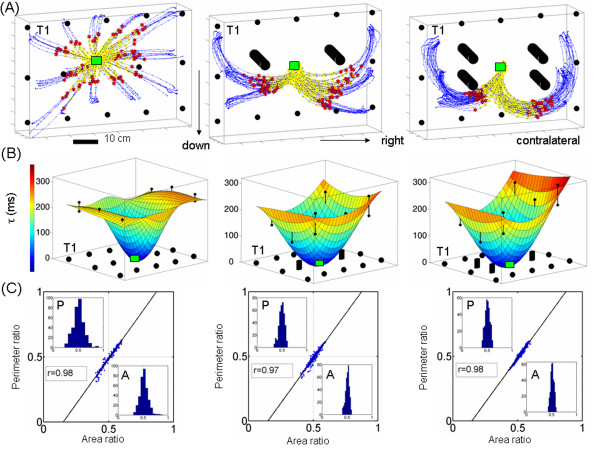
Figure 5.
Geometric invariant at the crossroad of time and distance. Typical hand trajectories to targets in space with and without obstacles pooled from experiments in one day of early training (from one subject and similar to the other). Initial acceleration phase highlighted in yellow. (B) Fitted surfaces to obtain the mean temporal maps (tau ms) across space to reach the first peak velocity (red dots) on the way to targets in (A). On the xy-plane we represent by dots the locations of the targets and by cylinders the location of the obstacle(s). The distribution of tau reveals the underlying distribution of path length scaled by path curvature. (C) Time invariant geometric ratios (each point is from a trajectory) significantly co-varied. The similarity of the area and the perimeter ratios was confirmed by the Friedman's test [27] with the slopes and the intercepts of the regression lines as ([1,39, -0.21, [1,38, -0.20], [1,36. -0.20]) for straight, 1 obstacle and 2 obstacles respectively.

