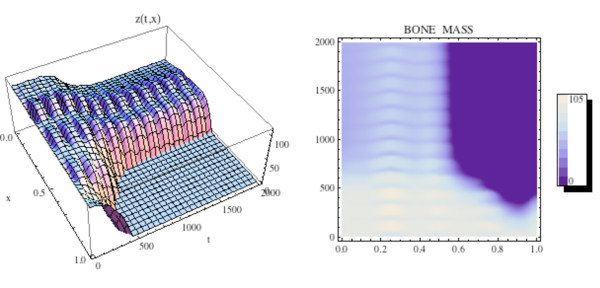
Figure 18.
The graph (left side) and density plot (right side) of the bone mass z(t, x) for the spatially dependent bone model with tumor and treatment (compare to Fig. 15). System of equations (16): Treatment stops the loss of bone mass from the advance of the tumor from the right side to the left side of the spatial region Ω = [0, 1] after initiation at tstart = 600. Bone mass already lost is not recovered on the right side of Ω as treatment continues.

