
Figure 4.
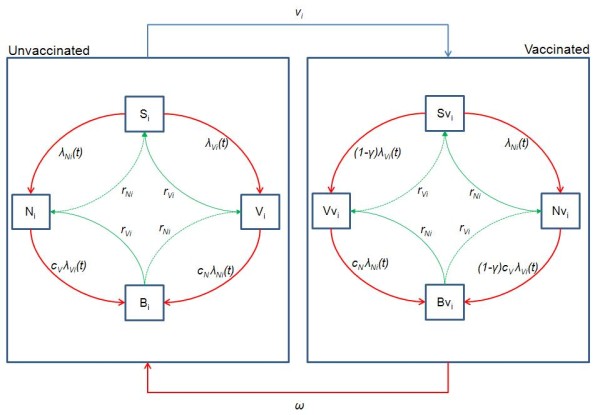
Model structure. Flow diagram illustrating the structure of the dynamic model used to assess pneumococcal vaccination. The following states are included: S, unvaccinated susceptible; Sv, susceptible vaccinated; V, unvaccinated carriers of pneumococcal serotypes contained in PCV7 or serotype 6A (vaccine serotype group, VT); Vv, vaccinated carriers of pneumococcal serotypes contained in PCV7 or serotype 6A; N, unvaccinated carriers of pneumococcal serotypes not contained in PCV7 (non-vaccine serotype group, NVT); Nv, vaccinated carriers of pneumococcal serotypes not contained in PCV7; i, age; t, time; λ, force of infection; γ, degree of protection against acquisition of VT carriage; ν, vaccine coverage; c, competition parameters; ω, waning rate of vaccine induced protection.