
Figure 5.
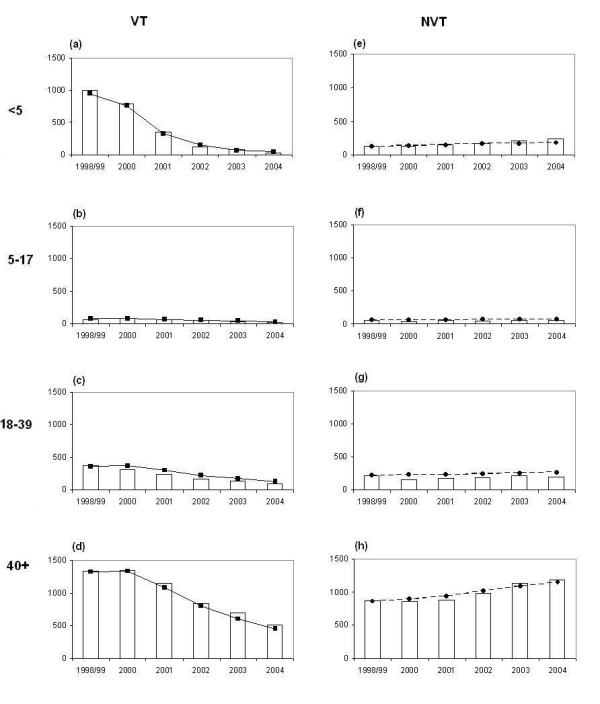
IPD cases: model projections vs. observed data. Observed (histograms) and fitted (filled squares and circles with lines) vaccine serotype group (graphs on the left) and non-vaccine serotype group (graphs on the right) IPD cases by age group in 8 counties of USA where the Active Bacterial Core Surveillance data collected the serotyped IPD data between 1998 and 2004.