
Figure 4.
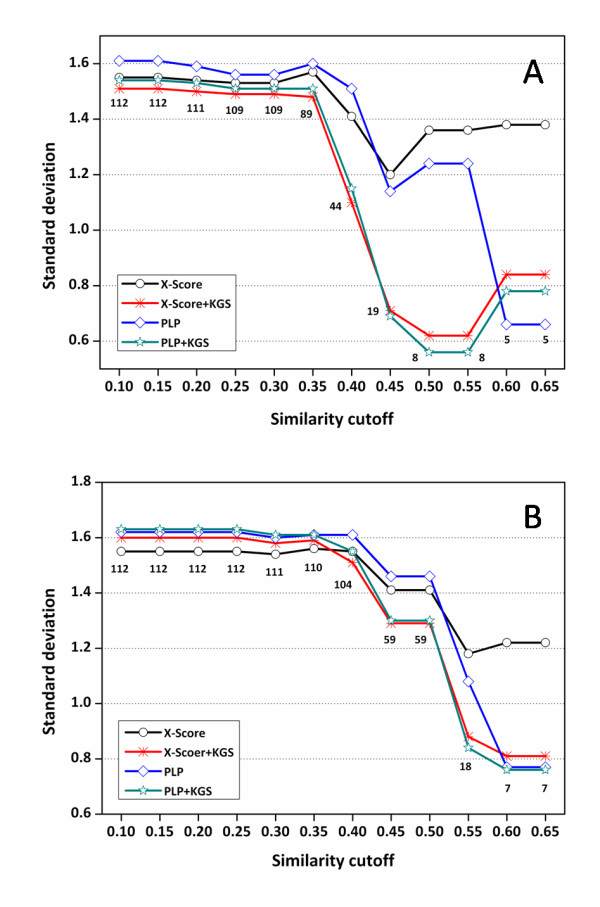
Standard deviations (in log Ka units) in fitting the experimentally measured binding constants of the HIV protease complexes and the binding scores computed by X-Score and PLP in combination with the KGS strategy. (A) Results obtained based on crystal structures (Set I). (B) Results obtained based on docking poses (Set II). The X axis indicates the similarity cutoffs used in defining reference complexes. The numbers indicated on this figure are the total numbers of the complexes considered at each similarity cutoff.