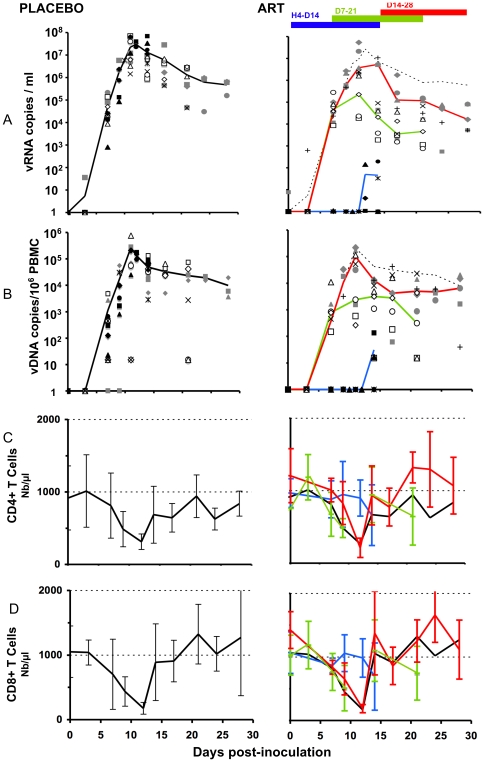
Figure 1. Peripheral viral loads and changes in CD4, and CD8 T cells in placebo- and ART-treated animals.
Placebo animals are shown on the left side (median in dark line), and treated animals, on the right side of the figure. Values for animals are given as a filled symbol and a star (group H4-D14); open symbol and x (group D7-21); grey symbols and + (group D14-28). Median curves are shown according to the date of treatment initiation, with the black or dotted line for placebo and blue, green, and red lines for the H4-D14, D7-21 and D14-28 groups, respectively. A) Plasma viral load; vRNA copies/ml of plasma. B) Total viral DNA in PBMCs; vDNA copies/106 PBMC. C) CD4 changes in absolute number (mean±SD) D) CD8 changes in absolute number (mean±SD).

