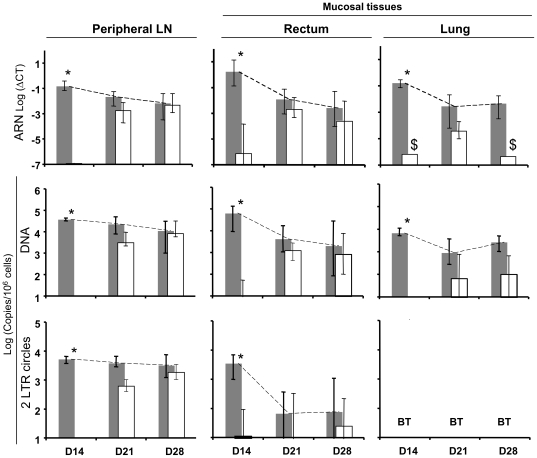
Figure 2. Change in viral loads in tissues in animals given placebo or treatment over the course of 14 days.
Viral loads were expressed using RNA Log (ΔCT), DNA and 2LTR Log(Copies/106 cells) at the top, middle and at the bottom of the figure, in peripheral LN, rectum, and lung (left side, middle, and right side), respectively. LN: lymph nodes; placebo animals (Gray bars), treated animals (white bars). Vertical bars represented the 95% confidence interval (95% CI). 2LTR values in the lung were below the threshold and were listed as BT. $ viral RNA was detected in only 1 animal in ART-treated animals on day 14 and day 28. * Significant differences between placebo and treated animals.

