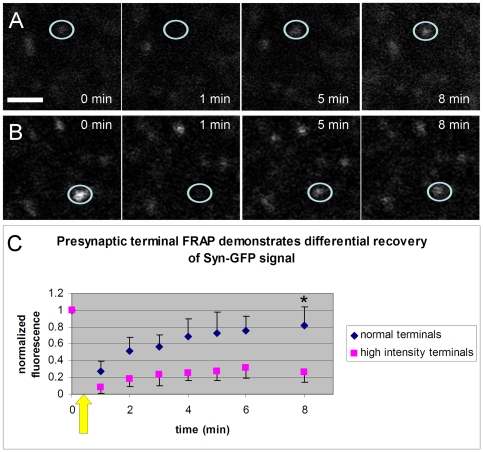
Figure 5. Syn-GFP presynaptic terminal signal recovers differently after photobleaching.
A. In vivo multiphoton images of the same region of Syn-GFP positive terminals over time. One normal terminal (marked by the white circle) is photobleached just after t = 0. This sequence shows full recovery of Syn-GFP signal over several minutes. B. Similar time sequence as in panel A but in this case one high intensity terminal (marked by the white circle) is photobleached just after t = 0. This sequence shows partial recovery of Syn-GFP signal. Scale bar A and B 5 µm. C. Group data plotting normalized fluorescence before and after presynaptic terminal photobleaching (marked by yellow arrow; normal terminals n = 15 terminals, high intensity terminals n = 10 terminals; n = 5 animals, error bars = 1 SD; * represents statistically significant difference at t = 8 min, t-test p<0.0001).

