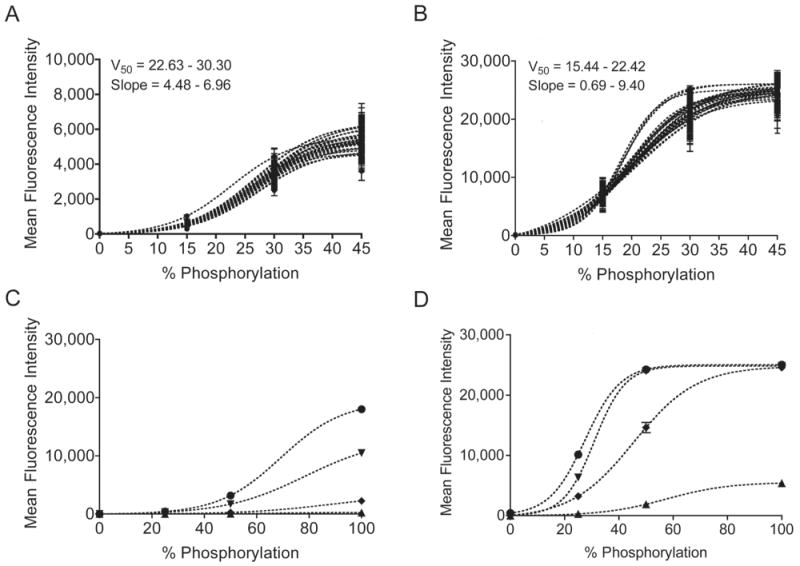
Figure 2.

Internal standard curves were constructed from four synthetic peptide standards in each well of a 96-well plate. The mean fluorescence intensity from four standards with varying degrees of immobilized synthetically phosphorylated Abltide is best modeled by a Boltzmann sigmoidal curve. Identical sets of standards labeled with either PY20-PE (A) or biotinylated 4G10 and streptavidin-PE (B) displayed large differences in the maximum fluorescence intensity. Within a single 96-well plate, well-specific standard curves displayed differences in slope and in the percentage of phosphorylation resulting in half maximal fluorescence (V50), as calculated from the average of 100-300 measurements per standard per well. Serial dilutions of fluorescent anti-phosphotyrosine antibodies were used to confirm the effect of concentration on maximal fluorescence and slope. C, PY20-PE at the following concentrations in decreasing order: 150, 15, 1.5, 0.15 ng/mL. D, 4G10-biotin at the following concentrations in decreasing order: 1000, 100, 10, 1 ng/mL. Error bars for all mean fluorescence measurements indicate 99% confidence intervals.
