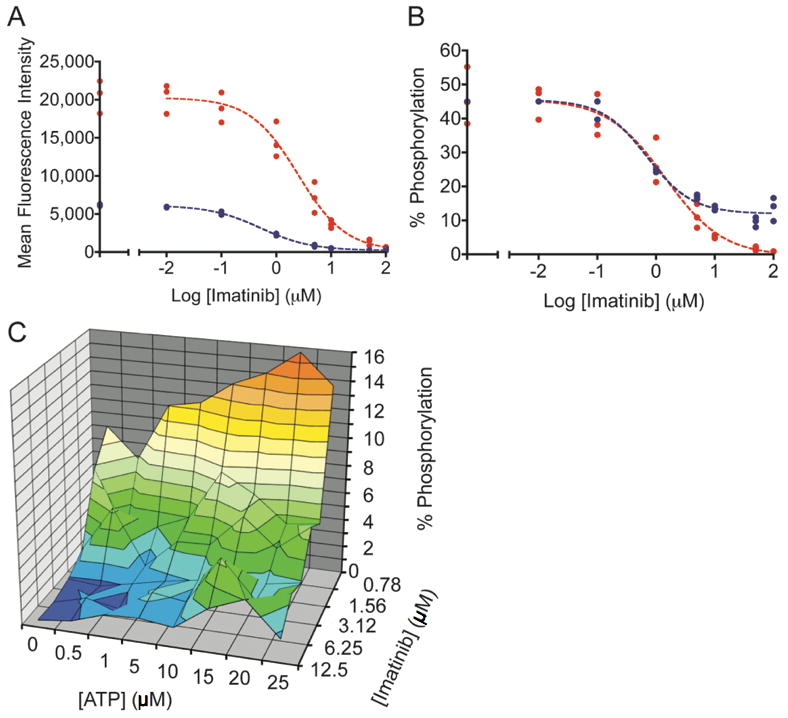
Figure 4.

Imatinib was incubated with K-562 cells or cell lysates. The sigmoidal decrease in Abltide phosphorylation as a result of intracellular kinase inhibition was monitored in cell lysates using PY20-PE or biotinylated 4G10 and streptavidin-PE. A, a three-fold difference between maximum mean fluorescence intensities in separate assays obscures direct comparisons. In blue, PY20-PE was used to label phosphorylated Abltide following the inhibition of lysates with imatinib (IC50= 0.52 μM). In red, biotinylated 4G10 and streptavidin-PE were used to label phosphorylated Abltide following incubation with lysates derived from K-562 cells treated with imatinib in culture (IC50= 2.48 μM). B, well-specific internal standard curves automatically correct for differences in raw fluorescence intensity between assays and are used to calculate the percentage of Abltide phosphorylation in each well. The blue curve represents the phosphorylation of Abltide by lysates treated with imatinib (IC50= 0.70 μM). The red curve represents the phosphorylation of Abltide by lysates derived from cells treated with imatinib in culture (IC50= 1.40 μM). Differences between IC50 values in A and B are the result of data transformations by non-linear regression from well-specific internal standard curves. IC50 values are not directly comparable between separate experiments because inhibition was performed under different conditions in each case. C, multidimensional analysis of Abltide phosphorylation reveals competitive dependence for ATP and imatinib in K-562 lysates. Serial dilutions of ATP and imatinib were organized along perpendicular axes of one half of a 96-well plate and incubated with K-562 lysates, which were prepared at high concentrations and diluted 50-fold to reduce the influence of endogenous ATP. Apparent IC50 values increase with increasing concentrations of ATP, as shown by the heat map that highlights 1% increments of substrate phosphorylation from red (15-16% Abltide phosphorylation) to dark blue (0-1% Abltide phosphorylation).
