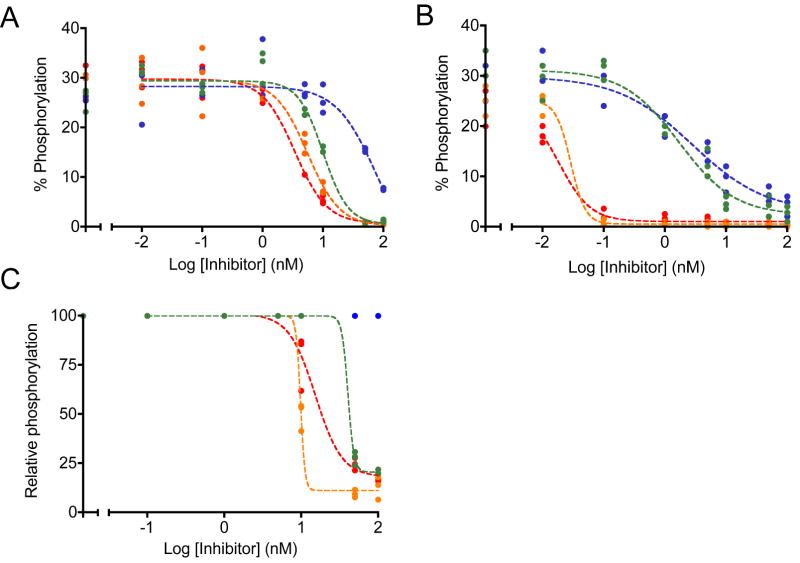
Figure 5.
Inhibition by dasatinib (orange), PD166326 (red), PD173955 (blue), and DV2-273 (green) was monitored in K-562 lysates. Sigmoidal inhibition curves were fit through biological triplicates. A, lysates prepared in bulk were treated with serial dilutions of inhibitors. Inhibition was monitored using Abltide, immobilized via its amino-terminus. Under these conditions, apparent IC50 values range from 75.7 nM (PD173955), 10.1 nM (DV2-273), 5.6 nM (dasatinib), to 3.4 nM (PD166326). B, populations of around 1 million confluent, serum-starved cells were distributed to each well of a sterile 96-well filter plate and treated with serial dilutions of inhibitors. Cells were lysed in-plate and lysates were used to phosphorylate Abltide. Under these conditions, apparent IC50 values range from 2.8 nM (PD173955), 1.7 nM (DV2-273), 0.03 nM (dasatinib), to 0.02 nM (PD166326). C, lysates prepared in bulk were treated with serial dilutions of inhibitors and monitored using Abltide in tandem with p40, arranged with Abltide distal to the immobilization site. Data were translated from raw fluorescence intensity to relative phosphorylation using internal standard curves constructed from synthetically phosphorylated Abltide. Under these conditions, apparent IC50 values range from 40.6 nM (DV2-273), 15.3 nM (PD166326), to 9.8 nM (dasatinib). Inhibition by PD173955 was not quantifiable.

