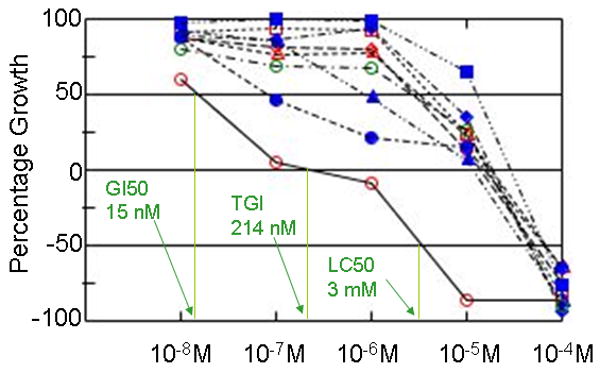
Figure 1. Dose-response graphs for dasatinib assayed in the melanoma panel, demonstrating endpoint calculations.

Dasatinib (NSC 732517) was tested at 5 concentrations (1 log dilutions from 10-4M to 10-8M). Growth percent of 100 corresponds to growth seen in untreated cells. Growth percent of 0 indicates no net growth over the course of the assay (i.e. equal to the number of cells at time zero). Growth percent of -100 results when all cells are killed. Three endpoints are routinely calculated: 1) GI50, the log M concentration yielding a growth percent of 50 (i.e. 50% growth inhibition), 2) TGI, the log M concentration yielding a growth percent of 0, or Total Growth Inhibition, and 3) LC50, the log M concentration yielding a growth percent of -50, or lethality in 50% of the starting cells. These endpoints are illustrated for cell line LOX-IMVI (red open circle). Other cell lines displayed are Malme-3M (red open diamond), M14 (red open triangle), MDA-MB-435 (red open square), SK-MEL-2 (solid blue circle), SK-MEL-28 (solid blue diamond), SK-MEL-5 (solid blue triangle), UACC-257 (solid blue square) and UACC-62 (open green circle).
