
Figure 3. Dose response graphs for all cell lines in the NCI60 panel exposed to imatinib (NSC 743414).
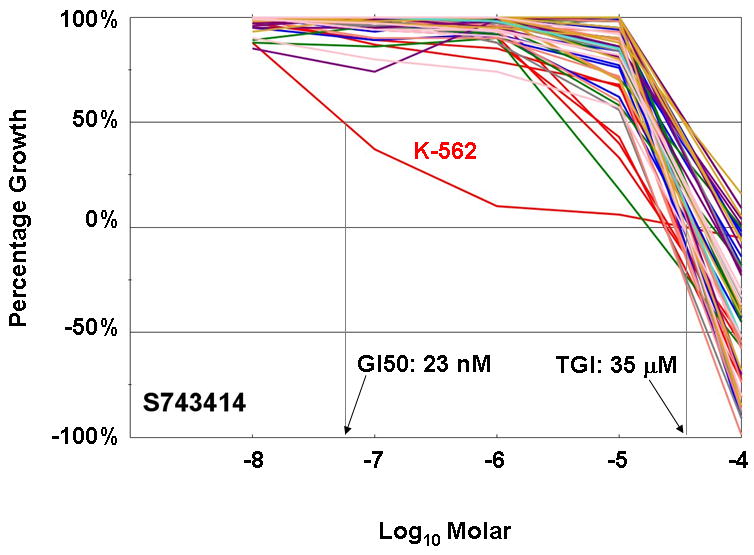
Imatinib was tested at 5 concentrations (1 log dilutions from 10-4M to 10-8M). Note that only one of the cell lines, K-562, which harbors a BCR-Abl gene fusion, has significant sensitivity to this BCR-Abl/KIT/PDGFR inhibitor. The GI50 and TGI concentrations for K-562 are indicated. Imatinib did not cause sufficient lethality in this cell line to calculate LC50. The graph is color-coded by tissue of origin: Red for leukemia, blue for lung cancer, green for colon cancer, grey for CNS cancer, coral for melanoma, purple for ovarian cancer, gold for renal cancer, turquoise for prostate cancer and pink for breast cancer cell lines.