
Figure 4. NCI60 graphs for bortezomib (NSC 681239).
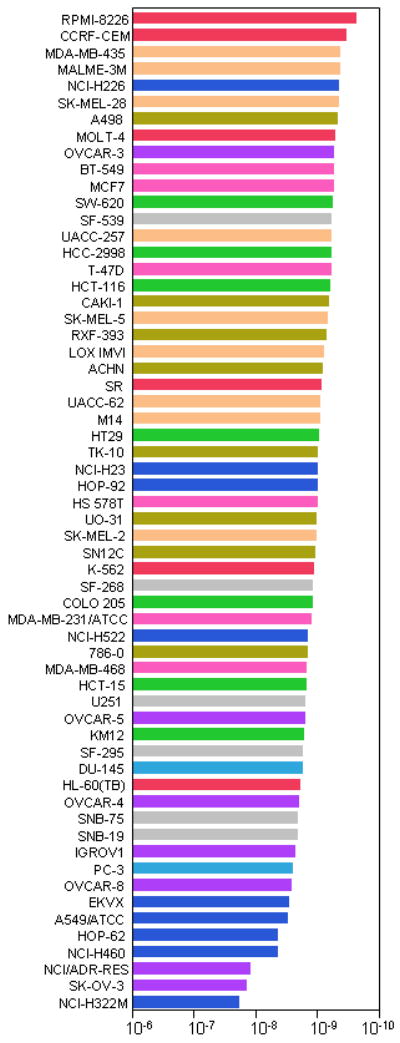
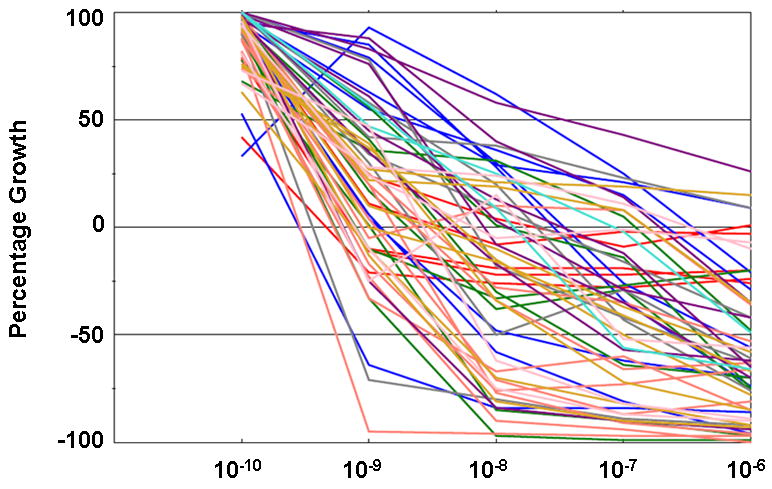
The data for bortezomib tested at 5 concentrations (1 log dilutions from 10-6M to 10-10M) are presented in two different formats. Figure 4a: GI50 molar values presented as a “waterfall” plot, with the most sensitive cell lines for each endpoint at the top of the graph. Figure 4b: Dose-response curves for all cell lines overlaid on the same plot. Cell lines are color-coded as for Figure 3.