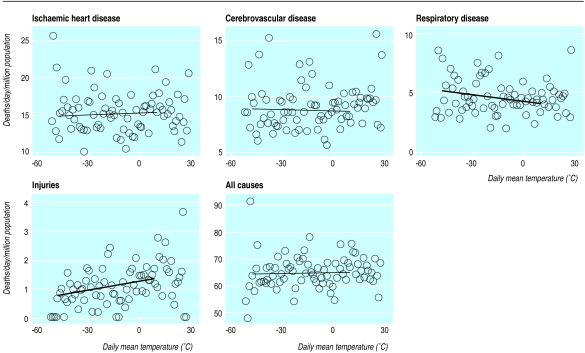
Figure 4.
Regression analysis of daily numbers of deaths from ischaemic heart disease, cerebrovascular disease, respiratory disease, injuries, and all causes per million population aged 50-59 and 65-74 by mean daily temperature (range 10.2°C to −48.2°C). Thick lines indicate P<0.05, thin lines P>0.05

