
Figure 5.
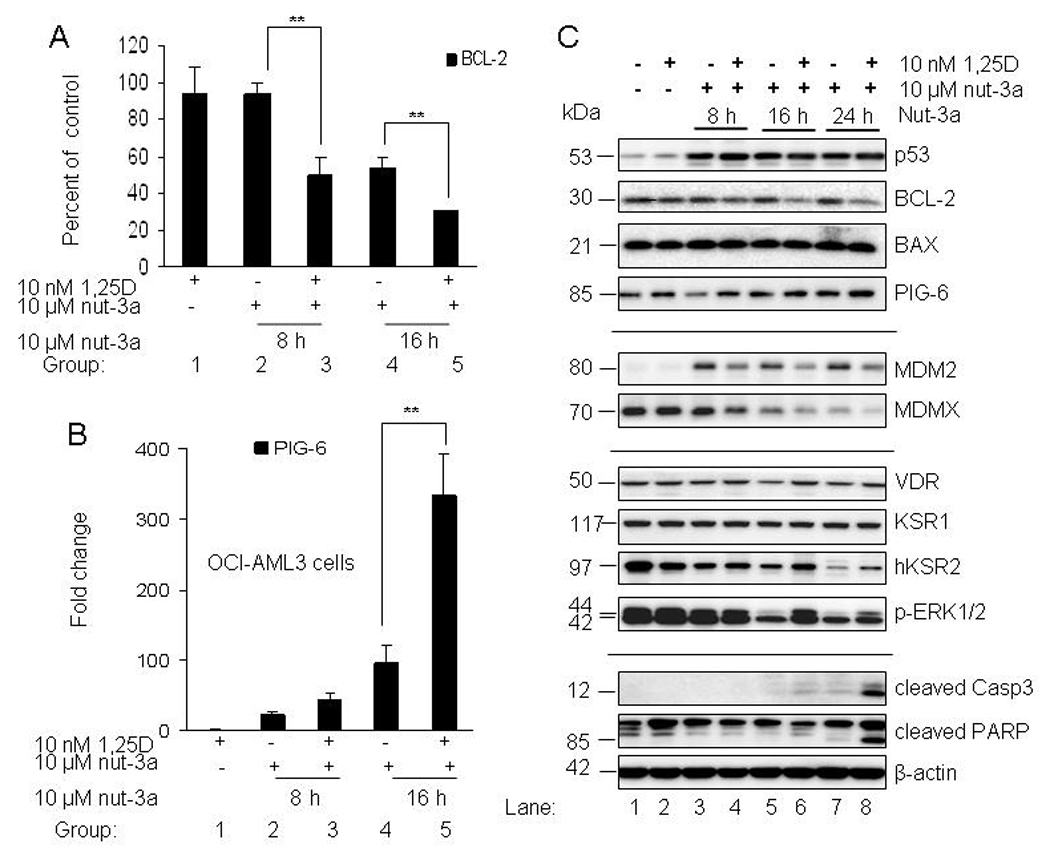
1,25D enhances the downregulation of BCL-2 and elevation of PIG-6 in OCI-AML3-cells. A. OCI-AML3 cells were incubated with 10 nM 1,25D for 48 h and 10 µM nutlin-3a was added during the last 8, 16 and 24 h. Cells were also exposed to single agents; 10 nM 1,25D for 48 h and 10 µM nutlin-3a at the indicated time points. Treated cells were lysed, total RNA isolated and converted to cDNA. Quantitative real time PCR was used to analyze transcriptional expression of BCL-2 relative to basal level, at the indicated time points. B. Transcriptional expression of PIG-6 relative to basal level, at the indicated time points was determined by quantitative PCR. The bars represent average values ± SD from three independent experiments, with PCR reactions of triplicate wells. P values were determined by Student t-test, where ** indicates p<0.05. C. For Western blotting, proteins extracted from samples were resolved in 4–20% SDS-PAGE, transferred to PVDF membranes and incubated with the indicated antibodies.