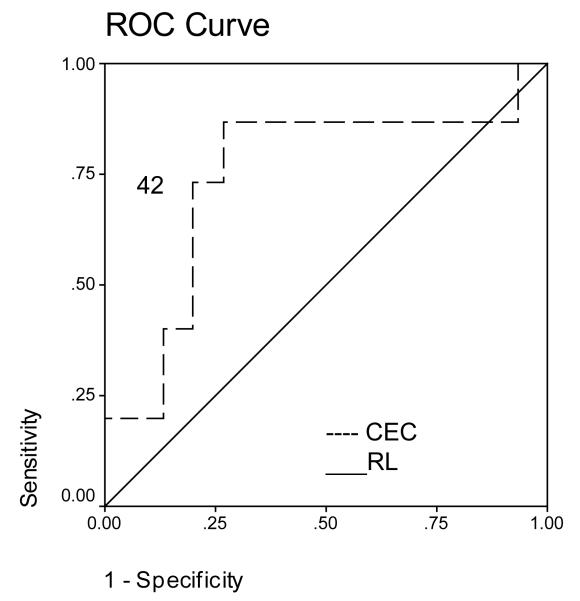
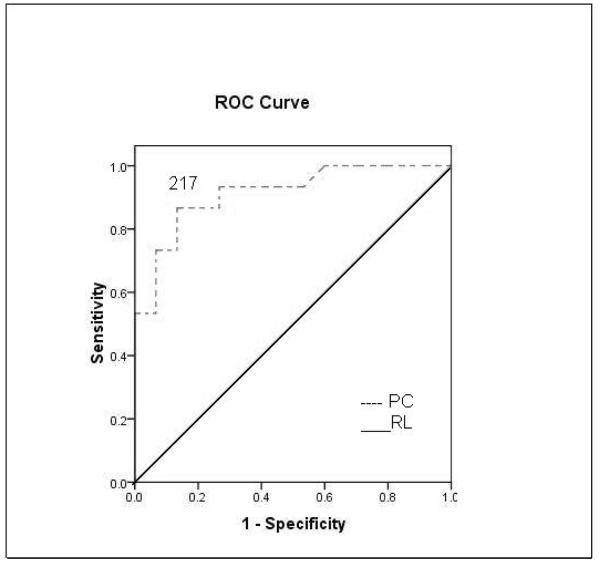
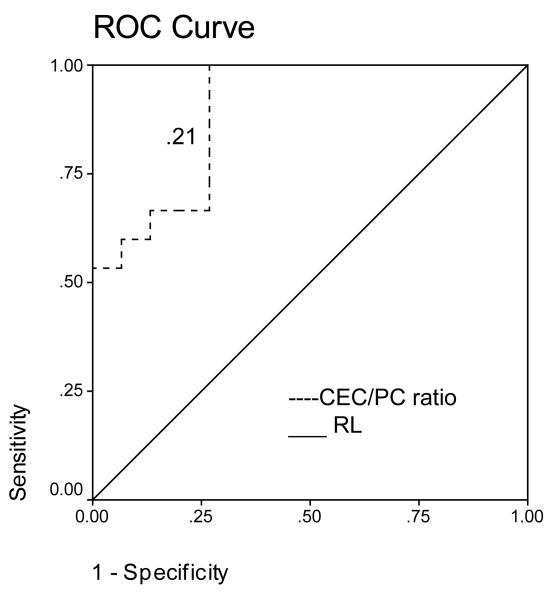
Figure 3.
A. ROC curve for CEC for diagnosis of cirrhosis. A CEC cut-off value of 42 cells/4ml showed a sensitivity of 87% and specificity of 74% for differentiating cirrhosis from controls. Area under the curve was 0.74. B. ROC curve for platelet count for diagnosis of cirrhosis. ROC analysis revealed that a platelet count cut-off value of 217 cells/ ml had an initial sensitivity of 93% and specificity of 73% for differentiating cirrhosis from controls. Area under the curve was 0.91. C. ROC curve for CEC/platelet count (CEC/PC) ratio for diagnosis of cirrhosis. A CEC/PC ratio at cut-off value of 0.21 showed a sensitivity of 100% and specificity of 73%. Area under the curve was 0.89. RL- Reference Line


