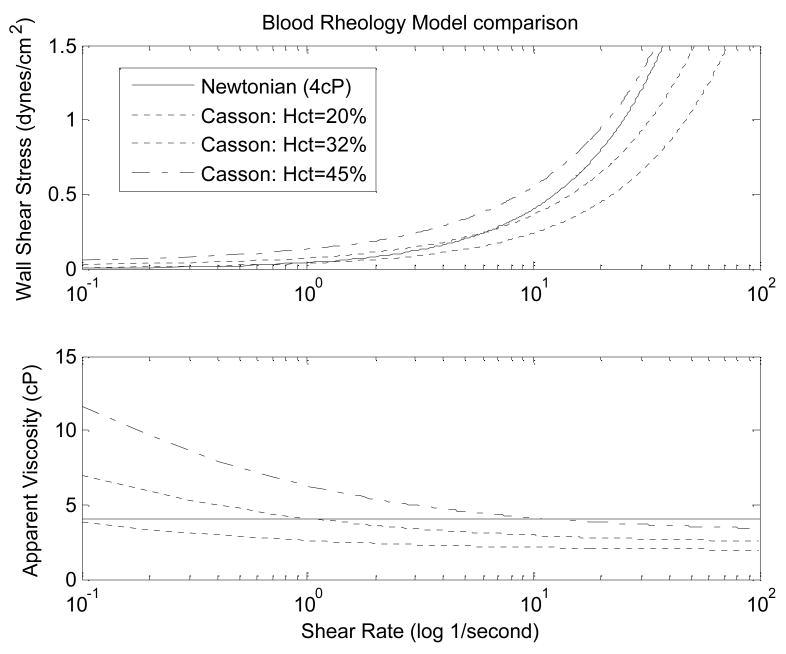
Figure 5.
Comparison of the Newtonian fluid model of a single constant viscosity (solid) and Casson fluid models of blood hematocrit of 20%, 32%,, and 45%. At normal hematocrit levels of 32–43%, blood viscosity significantly varies from the Newtonian-assumed constant viscosity at shear rates less than 1/second.

