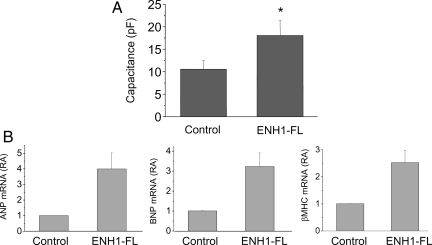
Figure 4.
ENH1 overexpression induced hypertrophy of ventricular neonatal cardiomyocytes. (A) The volume of cardiomyocytes was determined by measuring the electrical capacitance of the plasma membrane using the whole-cell configuration of the patch-clamp technique. Cells were plated on glass coverslips and infected with ENH1-FL adenovirus. The capacitance was measured 48 h after infection. Shown are means and SD of four independent cell preparations (n= 25 cells per condition). *P < 0.01. (B) Hypertrophic marker gene expression. Cardiomyocytes were infected with ENH1-FL adenovirus for 48 h. The relative mRNA expression of three marker genes of cardiac hypertrophy, ANP (left), BNP (middle), and βMHC (right) were measured by real-time PCR using 100 ng of total RNA. Shown are the means and SD of three independent cell preparations.

