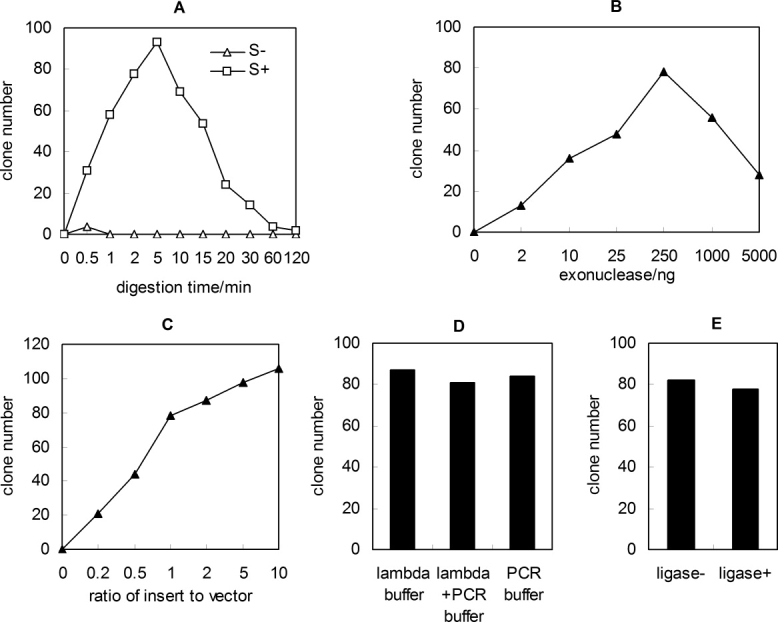
Figure 2.

Optimization of protocol. The exonuclease reaction time (A), the amount of λ exonuclease (B), the molar ratio of insert to vector (C), the reaction buffer (D), and the addition of T4 DNA ligase (E) were studied for obtaining the best protocol. In Figure 2(C), constant amount of linear vector (10 ng) and different concentrations of insert were used. Equimolar PCR fragments (10 ng pUC18 and 4 ng ape_0119) was used in the optimization of other parameters. Except for Figure 2(B), the λ exonuclease digestion reactions contained 250 ng λ exonuclease/pmol DNA. The capital letter S indicates phosphorothioate.
