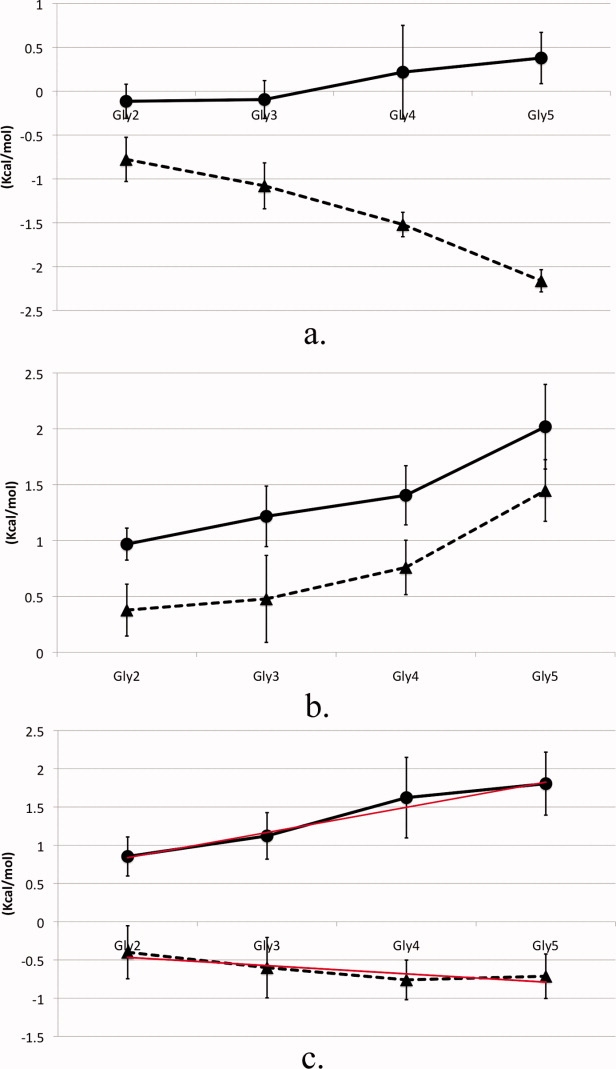
Figure 3.

Peptide backbone model calculated ΔGtr of TMAO solution (circles) and urea solution (triangles) from water. (a) vdW component, (b) electrostatic component, and (c) total transfer free energy with trend line (red) determined using weighted least squares fitting. Error bars were calculated by separating the data set into three blocks and computing the averages and standard deviations between the different sets.
