
Figure 3.
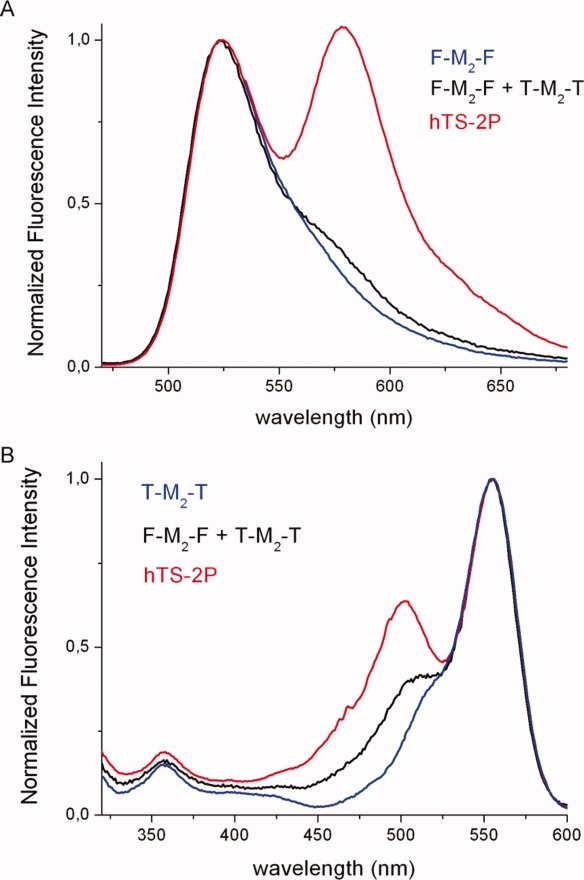
(A) Fluorescence emission spectra of the fluorescein-labeled hTS (F-M2-F, blue curve), of an equimolar mixture of F-M2-F and T-M2-T (T = tetramethylrhodamine, black) and of the hetero-dilabeled protein (red, hTS-2P). (B) Fluorescence excitation spectra (λem = 610 nm) of the T labeled TS (T-M2-T, blue curve), of an equimolar mixture of F-M2-F and T-M2-T (black) and of the dilabeled protein (hTS-2P, red). The spectra have been normalized, respectively, to the F emission (524 nm) and T excitation (555 nm) maxima for ease of comparison. [Color figure can be viewed in the online issue, which is available at http://www.interscience.wiley.com.]