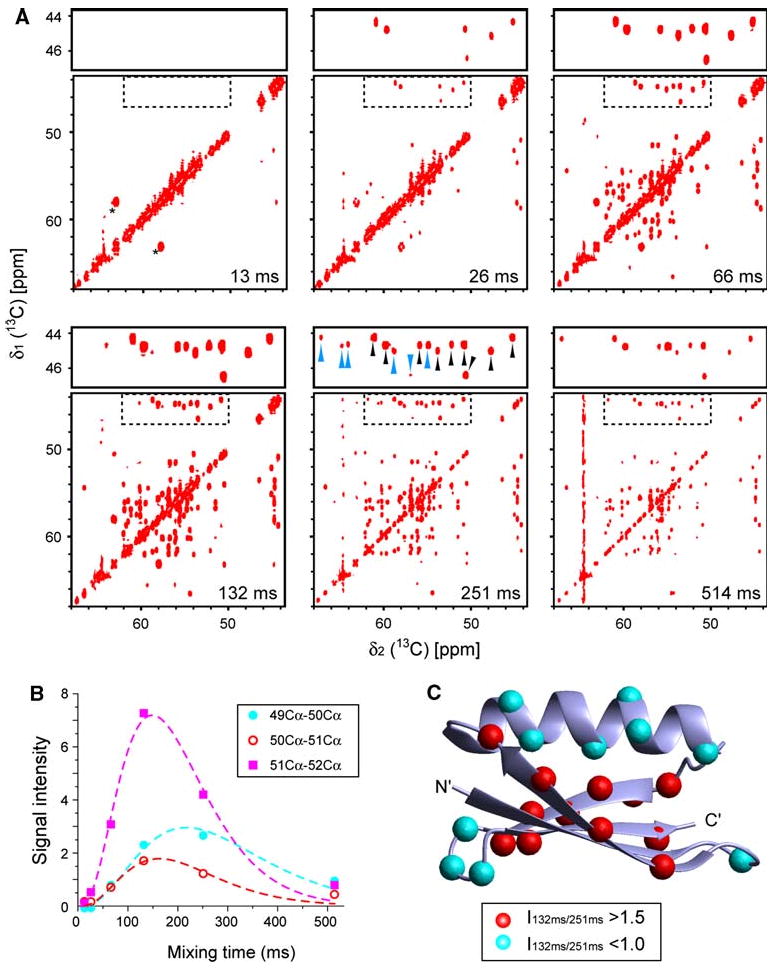
Fig. 2.

Mixing efficiency of the CACA-TOCSY experiment with [U-2H, 15N + 2-13C]-GB1 (5 mM) recorded in 20% glycerol at 285 K, which corresponds to a 90 kDa protein in aqueous solution at room temperature. a The CACA-TOCSY spectra at various mixing times ranging from 13 to 514 ms. As easily analyzable areas, the regions containing correlations to glycine residues (dotted square) are enlarged on top of each spectrum. Black and cyan arrow heads in the enlarged section at 251-ms mixing time indicate sequential and long range (i:i−2 or i:i+2) correlations between Cα nuclei, respectively. The measuring time for each spectrum was 5.5 h. The black asterisks in the 13 ms mixing time spectrum denote signals arising from natural abundance 13C-nuclei of glycerol. 2D CACA-TOCSY experiments were recorded with a spectral width of 6,887 Hz (direct) × 6,910 Hz (indirect), on a Bruker (Billerica, MA) Avance 500 spectrometer equipped with a triple-resonance carbon-cryogenic probe (TXO) designed for carbon detection experiments. 512 and 128 complexed data points were recorded for direct and indirect directions, respectively. Eight scans were applied for each increment. The digital resolution in the direct and indirect dimensions after Fourier transformation was 13.5 and 54.0 Hz for the 2D CACA-TOCSY. b Examples of build-up curves for three sequential correlations (residues 49–50, 50–51, and 51–52). Curves are drawn to approximately fit the TOCSY time course. c Location of residues that have fast and slow build up rates, respectively. On the three-dimensional structure of GB1, correlations with ratios of intensities between 132 and 251 ms, I132/I256 ≥ 1.5 or ≤ 1.0 are indicated by the red and cyan spheres in positions, respectively
