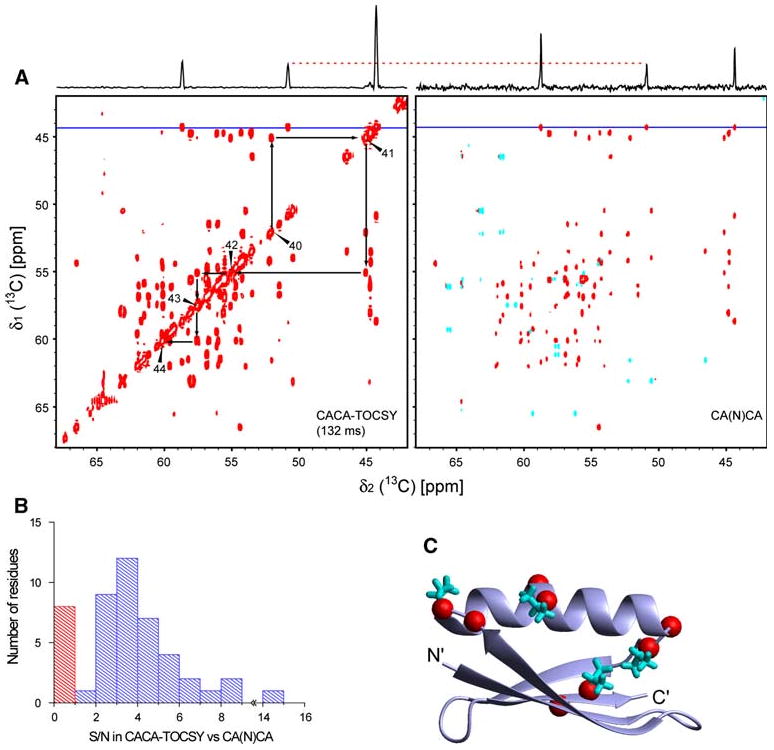
Fig. 3.

Comparison between the CACA-TOCSY and CANCA experiments. a The CACA-TOCSY (132 ms) and CANCA spectra were recorded at the same condition as in Fig. 2. The measuring time for each experiment was 5.5 h. Slices at the position of the horizontal blue lines (corresponding to Gly9) are shown on top of each spectrum. The vertical scales of the slices are normalized by the peak intensity of the middle resonances originating from Cα of residue Asn8. Black arrows in the CACA-TOCSY indicate the assignment walk connecting the Cα of residues 40–44. Starting from diagonal at , one can find the Cα frequency of the preceding or succeeding residue ω ( or ). b Histogram of the ratios of the signal-to-noise values (S/N) in the CACA-TOCSY over the S/N in CANCA. The average of the S/N values for and correlations is used. Bars representing ratios larger and smaller than 1 are colored blue and red, respectively. c Mapping of correlations that have smaller S/N value in the CACA-TOCSY. On the three-dimensional structure of GB1, red spheres positioned at the positions indicate correlations with S/N(CACA-TOCSY)/S/N(CA(N)CA) < 1.0. The side chains of Val residues are shown in cyan stick representations
