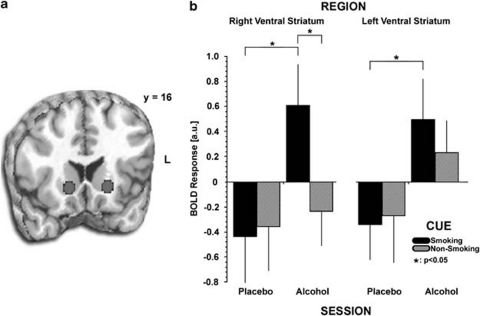
Figure 4.
(a) Brain image illustrating the functional ROI from which data were extracted. (b) Mean β weights (±SEM) extracted from right and left ventral striatum, with a significant beverage × cue interaction in the right ventral striatum to smoking cues during the alcohol session, *p<0.05, and post hoc exploratory t-test showing greater left vSTR activity to smoking cues on the alcohol vs placebo condition, *p<0.05.

