
Figure 6. Met participates in NFkappaB-mediated cell survival.
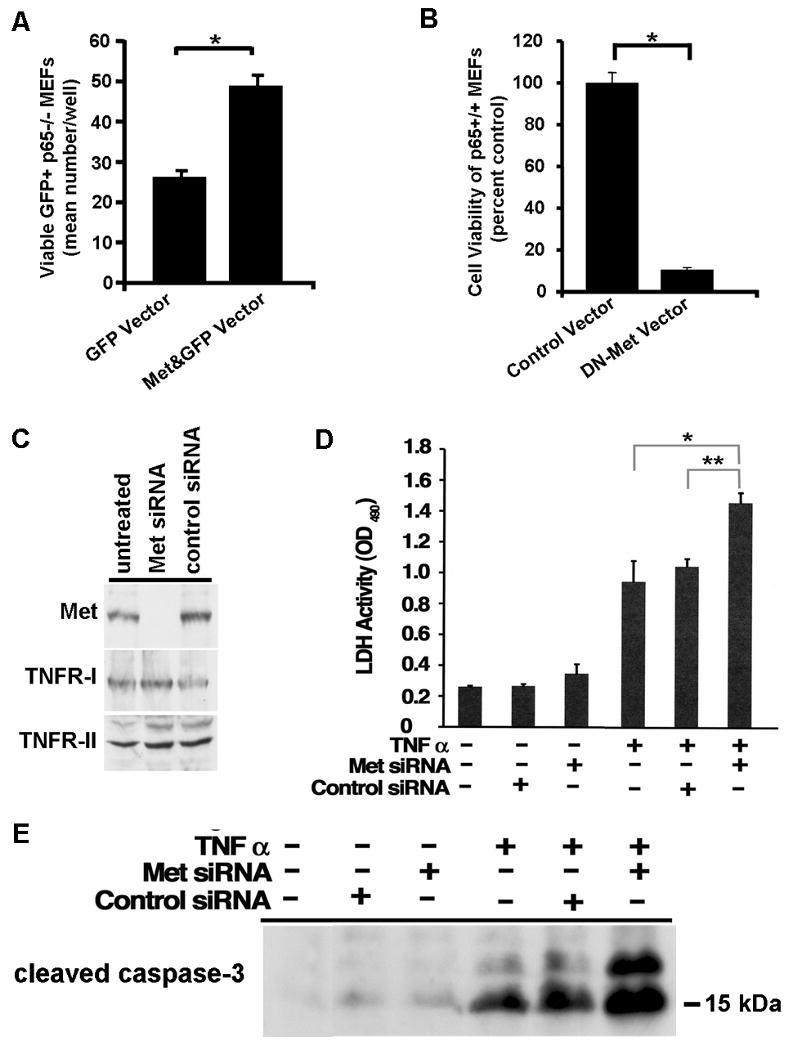
(A) A GFP expression vector was contransfected with (Met&GFP Vector) or without (GFP Vector) a mouse Met expression vector at a 1:10 ratio into p65-/- MEFs. Viable green fluorescent cells were counted after 12 h of TNF alpha treatment as described in Materials and Methods. Mean number of viable GFP+ cells per well was determined for each condition. Two tailed Student's t-test was performed on the data, and the statistical difference is indicated with an asterisk. *p<0.007 (B) p65+/+ MEFs were transfected with a bicistronic GFP expression vector either containing (DN-Met Vector) or lacking (Control Vector) a dominant negative form of mouse Met (DN-Met) and challenged by TNF alpha treatment as described in (A). The extent of cell viability was determined and calculated as percentage of viable cells as compared to control. Two tailed Student's t-test was performed on the data, and the statistical difference is indicated with an asterisk. *p<0.009 (C) HepG2 cells were subjected to siRNA mediated knock down of Met (Met siRNA). Total protein lysates were subjected to western blot analysis using anti-Met, anti-TNFR-I or anti-TNFR-II antibody. Levels of TNFR-I or –II did not change indicating the specificity of the Met siRNA for its target. Control – siRNA to GAPDH. Untreated – cells receiving no siRNA. (D) HepG2 cells treated with siRNA to Met or GAPDH (control siRNA) or with no siRNA received TNF alpha in the culture medium as described in Materials and Methods. LDH cell death assay was performed and optical density at 490 nm was measured. Two tailed Student's t-test was performed on the data, and the statistical differences between cells receiving TNF alpha in the presence or absence of the indicated siRNA are shown with asterisks. *p=0.005; **p=0.001 (E) Total protein lysates were prepared from HepG2 cells treated as in (D). Western blot analysis was performed using anti-cleaved caspase 3 antibody.