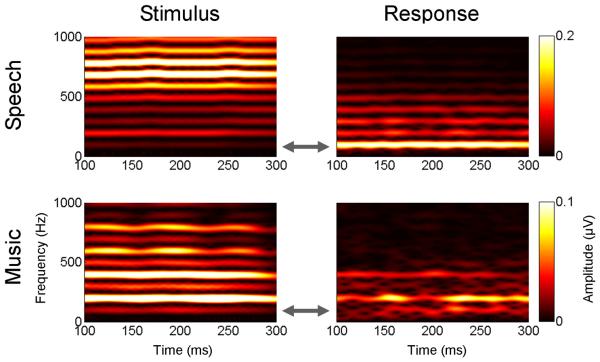
Figure 5. cABRs to harmonically complex signals.
The sustained aspects of brainstem responses (right) and their evoking stimuli (left) can be visualized using spectrograms (Section V and Figure 13). These graphs represent a 200 ms steady-state (unchanging) segment of the vowel /ɑ/ (top) and the cello note (bottom, see also Figure 2) used in Musacchia et al. 2007. In this example, the speech (top) and musical stimulus (bottom) have the same pitch (F0 = 100 Hz; arrows), yet have very different harmonic structures and consequently different timbres. These acoustic differences account for the different response patterns. For the cello (bottom), the dominant frequency bands occur at 200 and 400 Hz in both the stimulus and response. For the speech signal (top), the harmonics around the first formant (700 Hz) have much more energy than the F0. Yet, lower frequencies dominate the response. This reflects the low-pass nature of brainstem phaselocking and the nonlinear processes that amplify the energy of the F0 and the lower-harmonics. Adapted from Musacchia, Sams, Skoe and Kraus, 2007.

