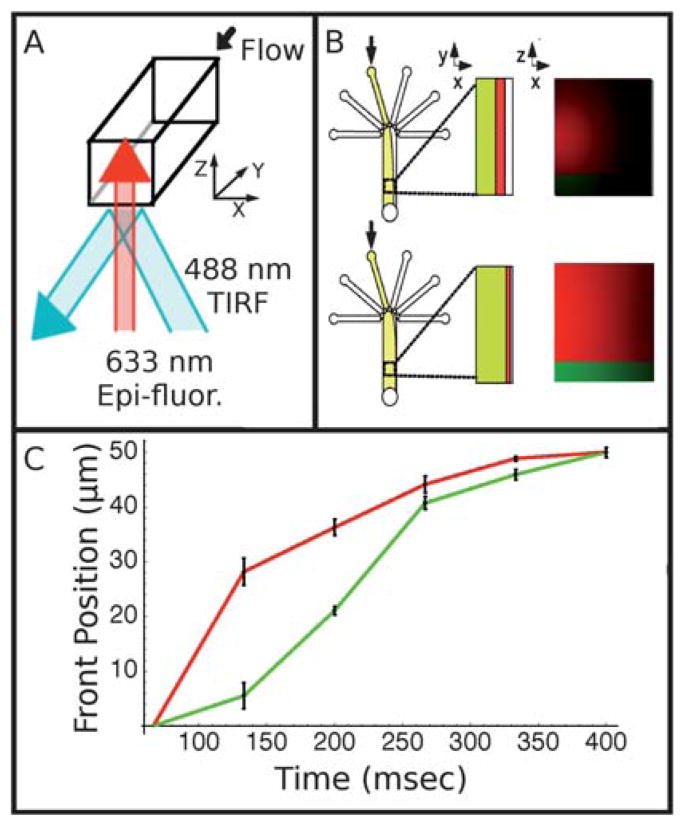
Fig. 3.
(A) Schematic showing optical strategy for two-color visualization of flow switching near the surface and in bulk. Red, 633 nm laser light is aligned for epi-fluorescence, while blue, 488 nm light is aligned for TIRF (total-internal-reflection fluorescence). (B) Diagram showing the progression of the dye front as seen in plan view and in cross-section with red fluorescence originating throughout the channel and green fluorescence originating only at the surface. (C) Graph showing the position of the dye front at the surface (green) and averaged across the focal region (red). The red, which represents the bulk, proceeds across the channel faster than the green, which represents the surface. Error bars represent the standard error among the data taken at several locations along the channel.

