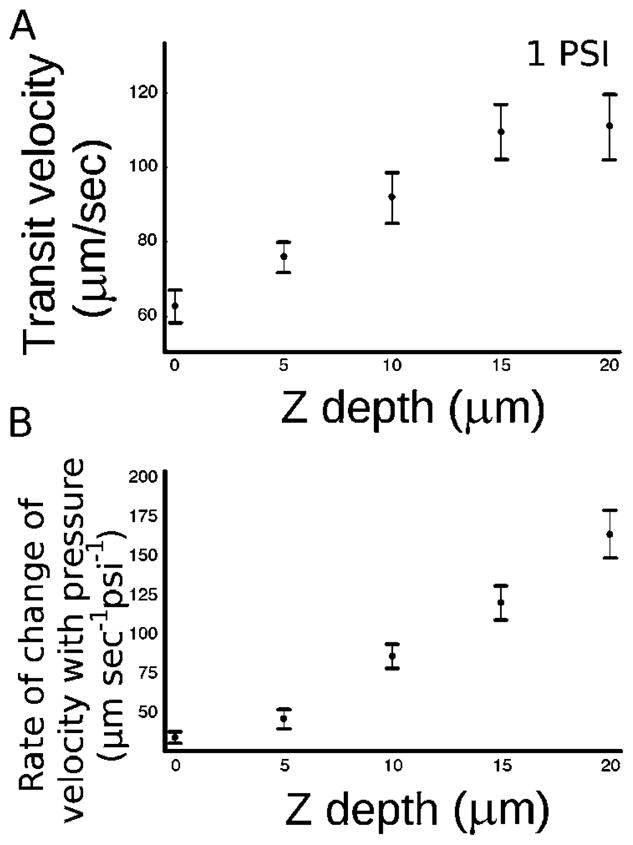
Fig. 4.

(A) A plot of the transit velocity of the dye front versus Z depth of the channel during laminar flow switching. The surface of the coverslip (floor of the channel) is at 0 Z depth. 1 PSI is the pressure differential between the inlets. (B) A plot of the rate of velocity increase with increasing pressure versus Z depth of the channel. This plot shows that most of the effect on velocity increase by increasing the applied pressure is seen in the center of the channel rather than near the surface. Error bars represent the standard error of the measurements.
