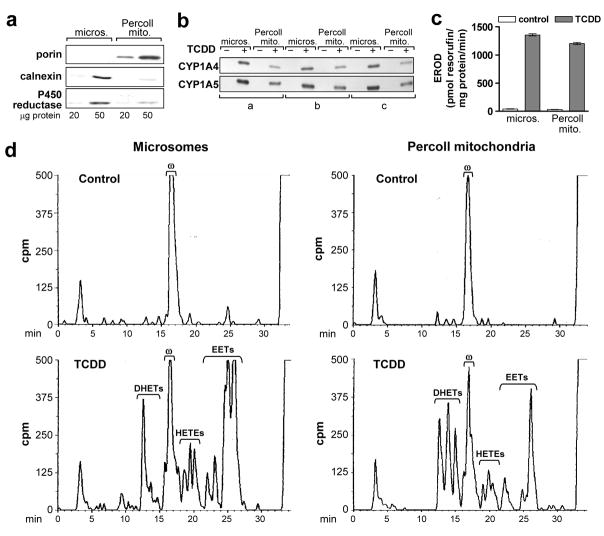
Figure 2. TCDD induced CYP1A4 and 1A5 and associated enzyme activities in mitochondria isolated by Percoll density gradient centrifugation.
Microsomes (micros.) and mitochondria (Percoll mito.) were prepared from livers of 17 day old CE 24 hr after treatment with TCDD at 1 nmol/egg or the solvent dioxane (control) (3 groups each for control and TCDD treated CE, 8 to 10 eggs per group). Mitochondria were isolated using a Percoll density gradient; microsomes were prepared from the same livers, concurrently, as described in “Materials and Methods”. a. Mitochondrial purity. Representative Western blot of Percoll mitochondria and microsomes from one of six groups using antibodies against porin (mitochondrial marker, 31 kDa), calnexin (ER marker, 78 kDa) and P450 reductase (ER marker, 78 kDa), at 20 and 50 μg protein per lane; samples from control or TCDD treated CE produced essentially the same results. b. CYP1A4 and 1A5. Western blotting of mitochondria and microsomes with antisera immunoselective for CYP1A4 or 1A5 (55 and 55.5 kDa, respectively); 10 μg of protein per lane. See Fig. 4c for specificity of antibodies. c. CYP1A4 mediated EROD activity. Mean values ± SE are shown (n = 3 for control and TCDD treated groups). d. P450-dependent arachidonic acid (aa) metabolism. Representative reverse phase HPLC chromatograms for P450-dependent aa metabolism by liver mitochondria and microsomes assayed as described in “Materials and Methods”. Retention times for EETs and DHETs (min) are as follows: 25.5–27.0 (5, 6 EET); 24.8–25.5 (8, 9 EET); 24.0–24.8 (11, 12 EET); 22.8–23.8 (14, 15 EET); 14.5–15.8 (8, 9 DHET); 13.5–14.5 (11, 12 DHET) and 12–13.5 (14, 15 DHET). Retention time for 20-HETE (ω): 16.0–17.5 min, for aa: 32.5 – 35 min. Total counts (cpm) for each chromatogram (left to right): 170,924; 168,865; 173,800 and 177,203; 75 μg protein per reaction mixture. Peaks eluting before 10 min are polar non-enzymatic breakdown products present also in the blanks (aa metabolism reaction mixtures without tissue or NADPH). Results for the two other control and TCDD treated groups were essentially identical.

