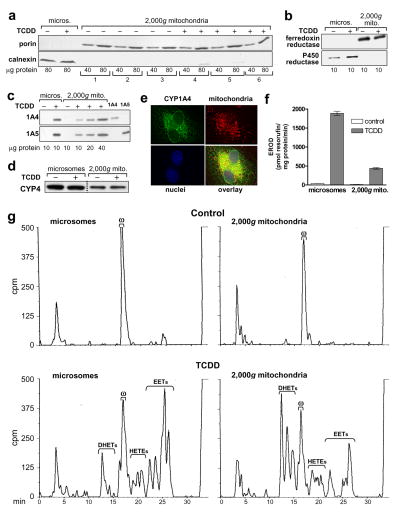
Figure 4. P450 levels and activities in 2,000g mitochondrial preparations; CYP1A4 mitochondrial localization by immunofluorescence.
2,000g mitochondria and microsomes were prepared as described in “Materials and Methods” from CE liver 24 hr after treatment with TCDD at 1 nmol/egg or dioxane, the solvent control, (8–10 eggs per group). a. Mitochondrial purity. Western blots of six groups of 2,000g mitochondria (from 3 control and 3 TCDD-treated groups of CE) using antibodies for porin (mitochondrial marker, 31 kDa) and calnexin (ER marker, 78 kDa); 40 and 80 μg of protein/lane. Microsomes from livers of control and TCDD treated CE are shown for comparison, at 80 μg of protein/lane. b. Western blotting for P450 reductase and ferredoxin reductase. Representative Western blots for microsomes and 2,000g mitochondria from control and TCDD treated CE, with antibodies to ferredoxin reductase or P450 reductase (48 and 78 kDa, respectively); all samples at 10 μg of protein/lane. c. Western blotting for CYP1A4 and CYP1A5. Representative Western blots for microsomes (lanes 1 and 2) at 10 μg per lane and 2,000g mitochondria (lanes 3–6), at 10 to 40 μg per lane, from control and TCDD treated CE livers, using immunospecific antibodies for CYP1A4 or CYP1A5 (55 and 55.5 kDa, respectively); last two lanes: purified CYP1A4 and CYP1A5 at 1.0 pmol/lane to demonstrate specificity of the antibodies. d. Western blotting for CYP4. Representative immunoblot for microsomes and 2,000g mitochondria from control and TCDD treated CE livers with an antibody to chick CYP4 (53 kDa) (see “Materials and Methods”); 25 μg of protein per lane. Microsomes and 2,000g mitochondria from the same membrane are shown (dotted line indicates where samples not relevant to these data were deleted from the picture shown). e. Immunofluorescence evidence for colocalization of CYP1A4 and mitochondria. D17 fibroblasts were stably transfected with a pCXIZ-CYP1A4 sense construct (see “Materials and Methods”). Cells were incubated with primary antibody to CYP1A4, using donkey anti-rabbit Alexa Fluor 488 as the secondary antibody (upper left panel), Mitotracker 580 to stain mitochondria (upper right panel) and DAPI (Sigma-Aldrich) to stain nuclei (lower left panel). Overlay (lower right panel) shows colocalization of mitochondria and CYP1A4 (yellow signal). An Axiovert 35, Zeiss fluorescence microscope was used for visualization (images shown were acquired at 63x). f. CYP1A4 mediated EROD activity. Values (mean ± SE) for EROD activity in microsomes and 2,000g mitochondria (n = 3 for each group). g . P450-dependent arachidonic acid (aa) metabolism. Representative HPLC chromatograms for P450-dependent aa metabolism by microsomes and 2,000g mitochondria from livers of control and TCDD treated CE, assayed at 75 and 150 μg protein per reaction mixture, for microsomes and mitochondria, respectively. Retention times for EETs, DHETs, 20-HETE and aa (min) as in Fig. 2d. Total counts (cpm) clockwise from top left to bottom left were 168,742; 186,617; 184,784 and 174,994.

